

How Much Does Amazon Make a Day? Revenue vs. Profit
Updated October 17, 2026. All amounts are in US dollars unless stated otherwise. Daily figures are calculated averages, not Amazon’s disclosed results for individual days.
Amazon generated about $1.96 billion in revenue per day in 2025, based on its latest completed financial year. Its average net profit was about $212.8 million per day over that same year. Those figures answer two different questions: how much Amazon sold, and how much accounting income remained after expenses and other financial items.
A newer view puts average daily revenue at $2.13 billion, using the twelve months ended June 30, 2026. That period’s net income needs extra context because investment gains lifted the reported result. Amazon’s annual results and latest quarterly results supply the underlying totals.
This guide separates revenue, operating profit, net income, and cash flow; shows the daily, hourly, and per-second calculations; explains AWS, retail, advertising, and seller fees; and compares annual averages with seasonal peaks. You’ll also learn which figures apply to US and Canadian readers, why competing answers differ, and how to check the next earnings report yourself.
How much does Amazon make a day?
Amazon averaged approximately $1.96 billion in daily revenue and $212.8 million in daily net income during 2025. Using the more recent twelve months through June 2026, average daily revenue was about $2.13 billion. Neither number describes the company’s sales on a specific calendar day.
The simplest answer uses a completed financial year because its beginning and end are clear. The newer trailing period is useful when you want a more recent picture, provided you keep the dates attached.
| Measure | Full-year 2025 total | Calculated daily average |
|---|---|---|
| Revenue, reported as net sales | $716.924 billion | $1.964 billion |
| Operating income | $79.975 billion | $219.1 million |
| Net income | $77.670 billion | $212.8 million |
Source: Amazon’s full-year 2025 financial statements. Daily averages are original calculations using 365 calendar days.
Revenue is the headline sales figure. Operating income measures the result after operating expenses. Net income also includes items below the operating line, such as investment gains, interest, and income taxes.
For a school assignment, presentation, or quick comparison, you can use this sentence:
“Amazon averaged approximately $1.96 billion in revenue and $212.8 million in net income per calendar day in 2025, calculated from its reported annual results.”
That wording communicates the amount, period, metric, and method. Leave any one of those out and readers can draw the wrong conclusion. A daily revenue figure without a year becomes stale; a profit figure without a definition becomes ambiguous.
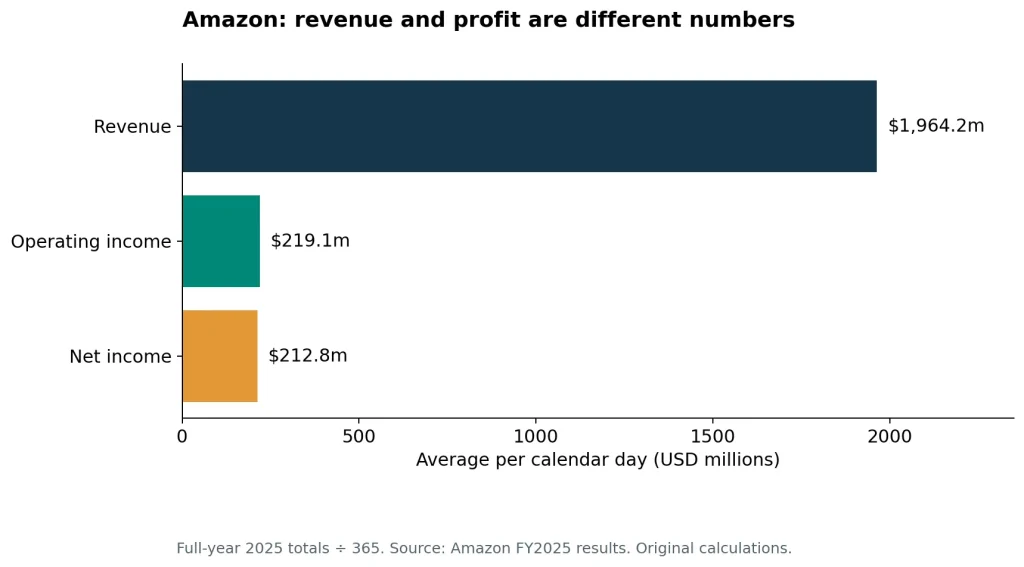
The same year produces very different answers depending on what “make” means.
Which answer should you quote?
Choose the 2025 average when you need a complete annual period. Choose the trailing-twelve-month average when you need the latest twelve-month window available for this article. Use a quarterly average only when the quarter itself matters to your question.
An annual average describes scale across an entire business cycle. A quarterly average can show a recent acceleration or a holiday-heavy period. Both are useful; neither should be silently substituted for the other.
How much profit does Amazon make each day?
Amazon’s 2025 average daily net profit was approximately $212.8 million, while average daily operating profit was approximately $219.1 million. The newer twelve-month period through June 2026 produced higher reported net income, but investment-related gains make that figure less useful as a stand-alone measure of recurring operating performance.
Start by deciding what kind of profit you want to measure. Operating profit and net profit are different stages of the income statement. Their relationship can change as taxes, financing costs, and investment valuations change. Revenue Sales recognized during a period, before subtracting the operating costs needed to produce those sales. Operating income Revenue less operating expenses. It focuses on the results of running the business before non-operating items and income taxes. Net income The accounting result after operating expenses, non-operating gains and losses, income taxes, and other applicable items. Free cash flow A cash-based measure whose definition must be checked. Amazon defines its measure using operating cash flow less specified net purchases of property and equipment.
A store can sell $1,000 of merchandise and spend $900 on the merchandise and other operating costs. Its operating profit is $100, even though it “made” $1,000 in sales. Add taxes or financing costs and the amount left as net income changes again.
Amazon applies these concepts on a much larger scale. That scale makes it tempting to turn every sales dollar into an imagined dollar of earnings. The income statement prevents that mistake by showing the costs between sales and profit.
Is the 2025 net profit figure an adjusted earnings measure?
No. The $77.670 billion figure is reported net income, not a normalized or adjusted estimate. Using an annual period does not remove investment gains or other unusual items that occurred within the year.
That distinction matters because an older, less volatile-looking period is not automatically a purer measure of the business. If the question concerns operations, use operating income and explain its own limitations. If the question concerns reported bottom-line earnings, use net income and preserve the relevant context.
A daily net-income average is not the cash Amazon can distribute every day. Cash collections, payments, capital spending, financing, and accounting recognition follow different schedules.
What do the latest 2026 results change?
The twelve months ended June 30, 2026 produced $775.680 billion in revenue, equivalent to approximately $2.125 billion per day. That is a newer reporting window than calendar 2025. Full-year 2026 results were not yet available when this article was updated, so this is not a completed-year 2026 figure.
The following table keeps the periods separate instead of blending them into one headline.
| Reporting window | Calendar days | Revenue total | Revenue per day | Operating income per day | Net income per day |
|---|---|---|---|---|---|
| Full-year 2025 | 365 | $716.924bn | $1.964bn | $219.1m | $212.8m |
| Twelve months ended June 30, 2026 | 365 | $775.680bn | $2.125bn | $256.7m | $370.6m |
| Second quarter 2026 | 91 | $200.606bn | $2.204bn | $301.8m | $688.4m |
Underlying totals come from Amazon’s annual and quarterly financial tables. These daily amounts are calculations, not day-level disclosures. The quarterly net-income result includes substantial non-operating other income.
Why did the net-income average increase so sharply?
Amazon reported $53.4 billion of non-operating pre-tax other income in the second quarter of 2026, primarily associated with its Anthropic investments. Its June 2026 Form 10-Q explains the valuation adjustments and related tax effects.
An investment can increase in accounting value without generating a matching increase in customer purchases. Consequently, a jump in net income does not establish that shoppers suddenly placed enough additional orders to create the same increase in retail profit.
You also cannot subtract a pre-tax investment gain directly from after-tax net income and label the remainder “true profit.” That combines measurements with different tax treatment. A defensible adjusted result needs a consistent reconciliation, including the associated tax effects.
Can you multiply the latest quarter by four?
You can calculate an annualized illustration, but label it as such. Multiplying one quarter by four assumes that quarter repeats, which may overlook seasonal demand, changes in costs, and unusual gains.
For a general daily-revenue answer, the trailing twelve months avoids treating a single quarter as the entire year. It includes a full sequence of quarters while updating the measurement window. Even then, it remains historical information rather than a promise about the next twelve months.
How are Amazon’s daily earnings calculated?
Divide the reported revenue or profit for a defined period by the actual number of calendar days in that period. Then divide the daily average by 24, 1,440, or 86,400 for hourly, per-minute, or per-second equivalents. Keep the reporting period and currency unchanged throughout the calculation.
The basic formula is:
Average daily revenue = reported period revenue ÷ calendar days in that period.
For 2025, the calculation is $716,924,000,000 ÷ 365 = $1,964,175,342.47. Rounding that to $1.96 billion per day gives readers an accurate sense of scale without suggesting that the final cents describe a measured daily sale.
A repeatable calculation method
- Open the company’s annual report or earnings release.
- Find the consolidated revenue line, called total net sales in Amazon’s statements.
- Read the units above the table, which may say “in millions.”
- Identify the exact start and end dates of the period.
- Count calendar days, including weekends and any leap day.
- Divide the total by those days and round only the final result.
- Repeat with operating income or net income if you need a profit comparison.
The unit check deserves particular attention. A table entry of 716,924 with a heading of “in millions” means $716.924 billion. Treating that entry as dollars understates the result by a factor of one million.
Why calendar days, rather than business days?
The purpose is to express annual scale per day across the entire reporting period. Using only weekdays would answer a different question. It would allocate the whole year’s recognized revenue to a smaller number of days and inflate the resulting daily figure.
Calendar-day allocation also avoids pretending that the company pauses its business every weekend. The calculation is an average across time, not a count of office opening hours.
For a leap year, use 366 days. For a quarter, count the actual months involved. April through June contains 91 days; July through September contains 92. Small denominator errors can change a large company’s daily average by millions of dollars.
How much does Amazon make per hour, minute, and second?
Using full-year 2025 results, Amazon averaged about $81.84 million in revenue per hour, $1.364 million per minute, and $22,734 per second. Average net income over the same period was about $8.87 million per hour, $147,774 per minute, and $2,463 per second. These are time allocations, not live measurements.
| Time unit | Revenue, 2025 basis | Net income, 2025 basis |
|---|---|---|
| Year | $716.924 billion | $77.670 billion |
| Day | $1.964 billion | $212.795 million |
| Hour | $81.841 million | $8.866 million |
| Minute | $1.364 million | $147,774 |
| Second | $22,734 | $2,463 |
Calculations use the annual totals cited above and 365 days, 24 hours per day, and 60 minutes per hour. Rounded values may not multiply back exactly.
A per-second number helps people understand magnitude. It does not mean Amazon recognizes an identical amount of revenue each second or receives a matching stream of cash in its bank accounts.
How long does it take Amazon to generate $1 million in revenue?
On the 2025 average, approximately 44 seconds. Divide $1 million by the unrounded average revenue per second to get that result.
The metric in that sentence is revenue. Calling it $1 million in profit every 44 seconds would change the claim dramatically. The word before the number matters as much as the number itself.
Is a monthly average the same as a month’s actual revenue?
No. Dividing the annual total by twelve gives a monthly allocation, while dividing by 365 and multiplying by 30 gives a thirty-day allocation. Those calculations use different definitions, so a small difference is expected.
A particular calendar month can also differ from both averages. February has fewer days than December, and seasonal sales are not evenly spread. State whether you mean an average month, a specific reported month, or a thirty-day equivalent.
Should you keep all the decimal places?
Keep them in your calculation file. Use fewer in the published explanation. Exact arithmetic based on an annual total does not make the result an exact observation of individual days.
A calculator can display $1,964,175,342.4657534, but $1.96 billion communicates the answer more clearly. Reserve additional precision for a methodology table where readers can check the inputs and reproduce the calculation.
Where does Amazon’s revenue come from?
Amazon’s revenue comes from online stores, physical stores, third-party seller services, advertising, subscriptions, AWS, and other activities. The retail website is only part of that mix. For 2025, Amazon’s revenue-category disclosures add to the same $716.924 billion consolidated total used in the daily calculation.
| Revenue category | Reported 2025 revenue | Calculated share of total |
|---|---|---|
| Online stores | $269.287bn | 37.56% |
| Third-party seller services | $172.162bn | 24.01% |
| AWS | $128.725bn | 17.96% |
| Advertising services | $68.635bn | 9.57% |
| Subscription services | $49.619bn | 6.92% |
| Physical stores | $22.561bn | 3.15% |
| Other | $5.935bn | 0.83% |
| Total | $716.924bn | 100.00% |
Source: Amazon’s 2025 Form 10-K, Note 10. Percentages are original calculations and rounded independently.
These categories are additive. You can sum them to consolidated revenue because they are alternative components within the same revenue presentation.
They should not be combined with the North America and International segment totals. Those geographical operating segments already contain several of these revenue types. Adding both presentations would count some business activity twice.
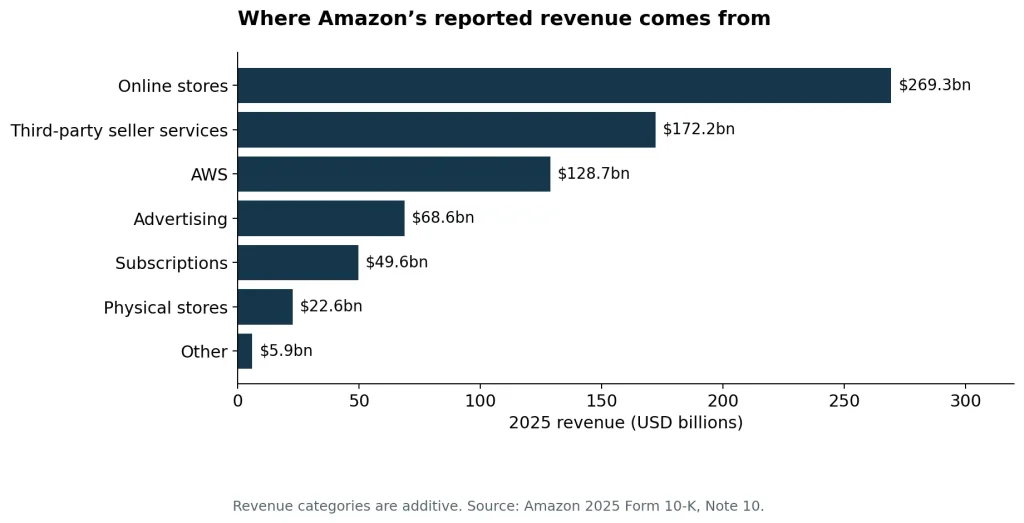
The revenue categories explain what Amazon sells; operating segments provide a separate view of how management reports the business.
Why the mix matters more than a single total
Imagine two businesses with the same sales. One resells goods and pays for inventory, packaging, and delivery. The other sells access to software or infrastructure. Their costs, capital needs, and accounting margins can differ even when revenue is identical.
Amazon combines several types of business. That is why an increase in total sales does not tell you which activity produced the increase or how much profit it created.
To understand the change, ask a second question: which category grew? Then ask a third: what happened to the costs supporting it? Those questions turn a large daily sales number into a useful analysis of the business.
How does Amazon make money from retail and outside sellers?
Amazon earns revenue by selling its own inventory and by charging outside sellers for marketplace and related services. Those transactions are recorded differently. A customer’s spending on an independently owned product does not automatically become an equal amount of Amazon revenue, even when the order is placed on Amazon’s website.
The annual report’s accounting discussion distinguishes gross product revenue from Amazon’s net share of third-party transactions. That difference explains why marketplace sales estimates can be larger than the revenue Amazon reports from sellers.
A first-party sale
Consider an illustrative $40 item that Amazon owns and resells. The sale can produce $40 of revenue, subject to the applicable accounting adjustments, while the cost of buying the item and operating the sale appears among expenses.
If the inventory cost were $24 and the remaining operating costs were $12, the simplified operating contribution would be $4. The example is deliberately hypothetical; it is not an estimate of Amazon’s actual margin on a particular product.
The point is that a retail sale includes both revenue and substantial costs. Seeing the full customer price on the revenue line does not mean the company kept that price as profit.
A third-party sale
Now imagine an outside seller owns a different $40 item. Suppose, purely for illustration, that Amazon earns $6 for one service and $5 for another. Amazon’s associated service revenue in this simplified example is $11, rather than the entire $40 customer purchase.
The seller has its own business results. It still needs to pay for the product, shipping arrangements, advertising, returns, and other costs. Its profit belongs in its own accounts, separate from Amazon’s consolidated net income.
The hypothetical service amounts above are examples, not published fee quotes. Actual fees vary by service and transaction. A current fee schedule and the seller’s own settlement records are needed for a real calculation.
What is gross merchandise value?
Gross merchandise value, commonly shortened to GMV, describes the value of goods sold through a marketplace under a stated definition. It is not interchangeable with the platform operator’s recognized revenue.
The distinction is useful beyond Amazon. Whenever a platform connects buyers with independent sellers, ask whether the published figure measures customer purchases, platform fees, or the platform’s own retail sales. Comparing those without adjustment can produce a misleading ranking of business size.
Why does AWS contribute so much operating profit?
AWS produced about 18% of Amazon’s revenue and 57% of its operating income in 2025, based on reported segment results. That imbalance explains why cloud performance matters so much to the consolidated business. Revenue share measures sales; operating-income share measures the contribution after segment operating expenses.
AWS sells computing infrastructure and services. Its offerings include computing capacity, storage, and databases, as described in the official AWS overview. Businesses can use that infrastructure to run applications and store or process information.
What the segment numbers show
| Amazon operating segment | 2025 revenue | 2025 operating income | Calculated operating margin |
|---|---|---|---|
| North America | $426.305bn | $29.619bn | 6.95% |
| International | $161.894bn | $4.750bn | 2.93% |
| AWS | $128.725bn | $45.606bn | 35.43% |
| Consolidated | $716.924bn | $79.975bn | 11.16% |
Source: Amazon’s full-year segment results. Operating margin equals segment operating income divided by segment revenue.
These are operating margins. They should not be described as separately reported segment net margins, because the table does not allocate all consolidated non-operating and tax items to those segments.
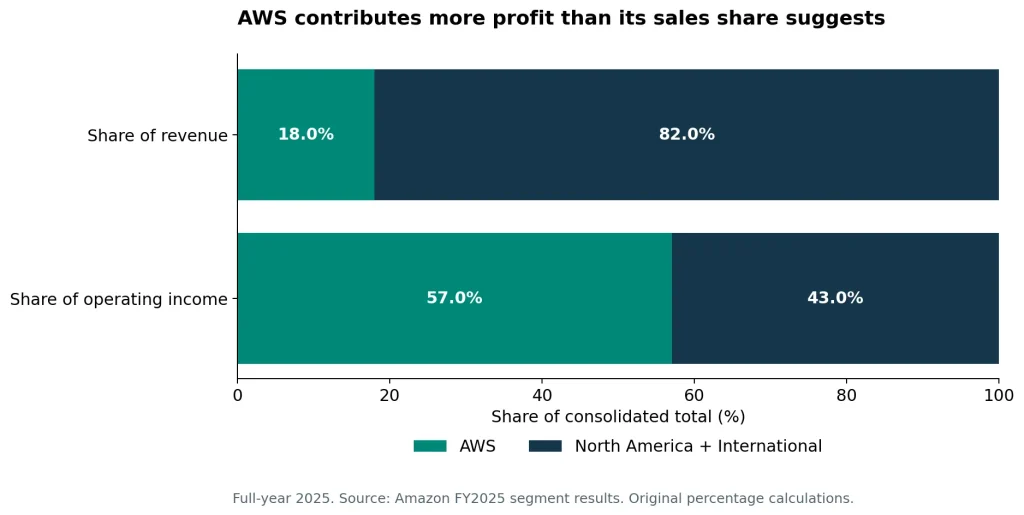
AWS’s share of operating income is substantially larger than its share of revenue.
What the numbers do not establish
A profitable cloud segment does not prove that every retail order loses money. Nor does it establish that advertising and subscriptions have the same margin as AWS.
The North America and International segments combine several activities. Their aggregate margins can reflect retail operations, seller services, advertising, subscriptions, and the cost structure of their respective markets. They are broader than a simple “online store” label suggests.
The careful conclusion is narrower: AWS generated a disproportionate share of reported operating income in this period. Explaining why each component earned its particular margin requires more detail than the consolidated daily-revenue calculation alone can provide.
Why not call all cloud revenue pure profit?
Cloud services require infrastructure, energy, maintenance, people, and continued investment. A higher margin still leaves a substantial difference between revenue and operating income.
For a useful interpretation, look at the sales line and the profit line together. Strong revenue growth accompanied by weaker margins tells a different story from strong growth accompanied by stable or improving margins. The daily sales figure contains neither answer by itself.
How do advertising and Prime support the business?
Advertising and subscriptions give Amazon revenue sources beyond individual retail purchases. Advertising earns money from promotion services, while subscriptions recognize fees for access to membership or digital services. Their reported revenue does not reveal a separately disclosed net profit for Amazon Ads or Prime alone, so precise standalone margins require more evidence.
Amazon’s Sponsored Products documentation describes those ads as cost-per-click advertising. A seller can therefore incur an advertising charge when someone clicks, even if that click does not produce a sale.
One transaction can create several different charges
A seller might pay for advertising, a marketplace service, and fulfillment in connection with its overall business activity. Those are distinct services. Their existence does not justify treating the full retail purchase as Amazon revenue and then adding every service fee on top without checking the accounting presentation.
This is where separating the participants helps. The shopper pays for a product. The seller recognizes its sale under its accounting policies. Amazon recognizes the revenue it earns for its own products or services under its policies.
Each participant has a different income statement, even when they are connected by the same order.
Why subscription revenue is not a simple member-count calculation
A tempting shortcut is to multiply a membership count by one advertised annual price. That misses differences in markets, billing plans, timing, and the scope of the reported revenue category.
Amazon’s subscription category includes more than one subscription product. Treating the entire line as Prime membership revenue alone would overstate what the category tells us.
Another timing issue arises when a customer prepays for a service. Receiving the cash and recognizing the revenue need not happen on the same date. Access provided over time can produce revenue over time, even if the payment arrived earlier.
Can you calculate Prime’s standalone profit from public revenue totals?
Not reliably from a consolidated subscription-revenue line. You would need an appropriate allocation of fulfillment benefits, content costs, customer service, and other supporting expenses, along with a clear definition of which activities belong to Prime.
It is reasonable to explain how membership can encourage repeat use. It is much less defensible to attach a precise profit margin to the membership program without a public reconciliation. This guide leaves that unsupported precision out.
Why is revenue different from cash flow?
Revenue records recognized sales, while cash flow tracks cash movements. Amazon can recognize revenue before collecting payment or receive payment before recognizing all related revenue. Operating cash flow also reflects noncash adjustments and working-capital changes, while free cash flow subtracts capital spending under a defined methodology.
Think of a small consulting business. It completes a $2,000 project and invoices the customer in December, but the customer pays in January. The work and the cash receipt occur in different periods.
Now reverse the situation. A customer prepays for a year of service. The cash arrives first, while the service is delivered over the following months. The receipt is not automatically the same thing as a full year’s immediately earned revenue.
These examples explain why the income statement and cash-flow statement answer different questions. Neither is a substitute for the other.
Amazon’s 2025 cash-flow bridge
Amazon reported $139.514 billion in operating cash flow and $11.194 billion in free cash flow for 2025. The difference reflects $128.320 billion in the net capital-purchase measure used in its free-cash-flow calculation. The annual release supplies the figures and definition.
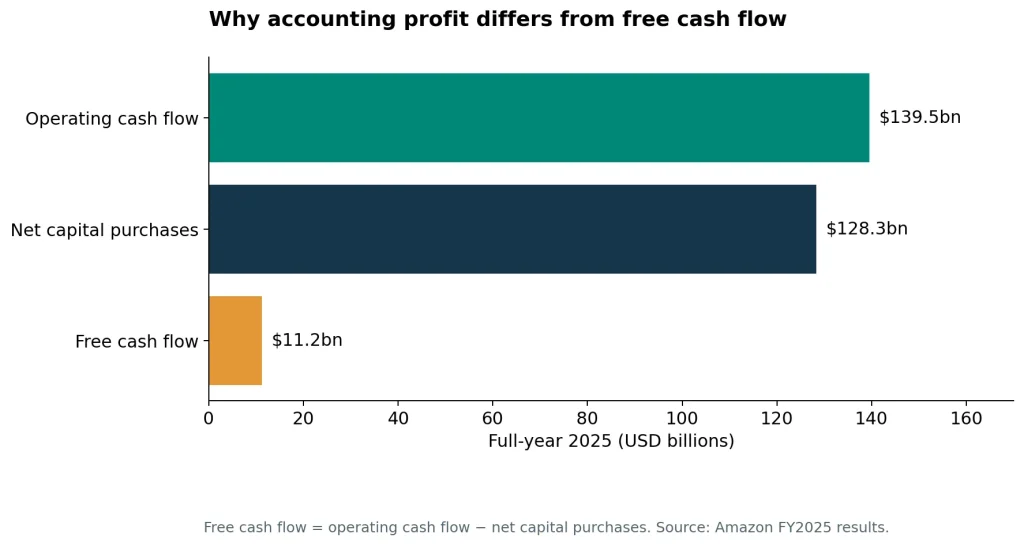
Operating cash generation and free cash remaining after specified capital purchases are different measurements.
Capital purchases can support several years of operations. Accounting expense for an asset may therefore follow a different schedule from the original cash payment. That timing difference can create a large gap between profit and free cash flow.
Can free cash flow be negative while profit is positive?
Yes. If capital spending exceeds operating cash flow under the chosen definition, free cash flow can be negative even when net income is positive.
That result does not, by itself, diagnose the business. You need to understand what the company bought, how it financed the spending, what obligations remain, and what future return management expects.
The opposite mistake is also possible: treating every investment as automatically worthwhile because it is described as growth spending. Future benefits still need to justify the resources committed.
Readers evaluating that question can use Lexislyfe’s explanation of the WACC formula and a worked example to understand how a cost-of-capital benchmark fits into investment analysis.
How much has Amazon’s daily revenue grown over time?
Amazon’s calculated average daily revenue increased from about $1.41 billion in 2022 to $1.96 billion in 2025. The comparison uses reported annual sales divided by actual calendar days. It measures historical revenue scale, while changes in profit require a separate look at expenses and non-operating items.
| Calendar year | Annual revenue | Days used | Calculated revenue per day |
|---|---|---|---|
| 2022 | $513.983bn | 365 | $1.408bn |
| 2023 | $574.785bn | 365 | $1.575bn |
| 2024 | $637.959bn | 366 | $1.743bn |
| 2025 | $716.924bn | 365 | $1.964bn |
Sources: Amazon’s 2023 annual results and 2025 annual results. Daily values are original calculations. The 2024 denominator includes February 29.
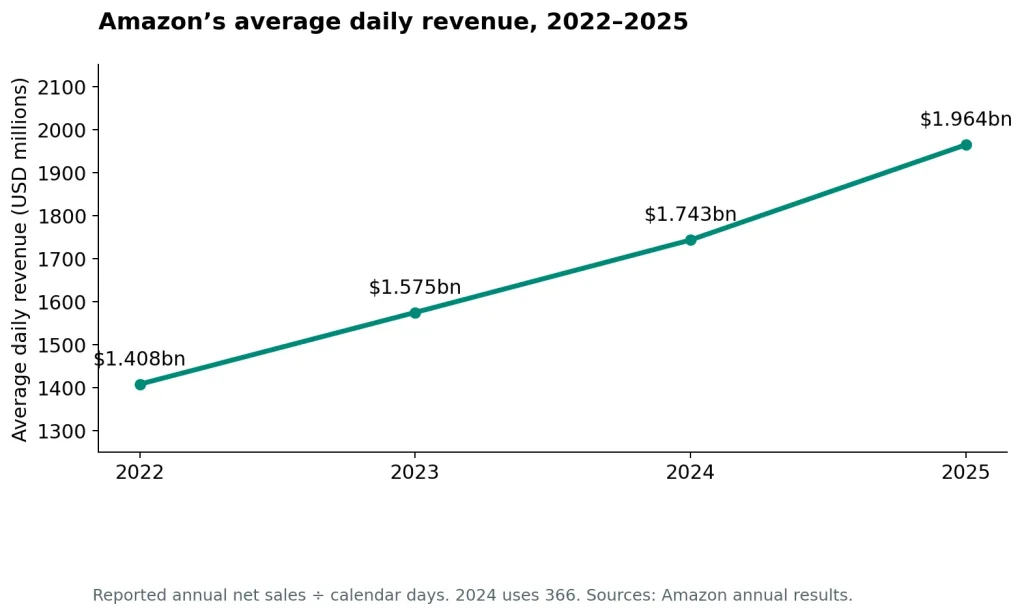
The series uses completed calendar years, rather than mixing annual figures with forecasts.
Why do some articles say $1.75 billion for 2024?
Dividing approximately $638 billion by 365 produces about $1.75 billion. Using the actual 366 days in 2024 produces about $1.74 billion.
For a rough comparison, the difference is small relative to total revenue. For a reproducible financial calculation, the denominator should match the period. A precise method is especially helpful when an article presents several years side by side.
Does sales growth mean equal profit growth?
No. If sales rise while costs rise faster, profit can grow more slowly or fall. Changes in the mix of goods and services can also change margins without a matching change in total sales.
An illustrative business with $100 of revenue and $90 of costs earns $10. If revenue rises to $110 but costs rise to $103, revenue has grown while profit has fallen to $7.
That example is a general explanation, not Amazon guidance. It shows why a rising line in a revenue chart should prompt further questions instead of ending the analysis.
Should older figures be removed entirely?
Historical figures remain useful when their dates are visible. They help explain growth and show why an older daily estimate might have been reasonable when first published.
The problem is presenting an older number as current. Updating the year in a title without updating the financial inputs can turn a historically correct statistic into a misleading answer.
Does Amazon make more during holidays and Prime Day?
Amazon’s average daily revenue varies by quarter, and an annual average smooths out those differences. Holiday shopping and promotional events can change demand, but a larger sales event does not automatically establish higher daily profit. Discounts, advertising, fulfillment, and returns can all affect the relationship between sales and earnings.
The quarterly averages provide a more grounded view than an unsupported estimate for an individual shopping day.
| Quarter | Reported revenue | Days | Calculated revenue per day |
|---|---|---|---|
| Q1 2025 | $155.667bn | 90 | $1.730bn |
| Q2 2025 | $167.702bn | 91 | $1.843bn |
| Q3 2025 | $180.169bn | 92 | $1.958bn |
| Q4 2025 | $213.386bn | 92 | $2.319bn |
| Q1 2026 | $181.519bn | 90 | $2.017bn |
| Q2 2026 | $200.606bn | 91 | $2.204bn |
Source: the six-quarter financial series in Amazon’s Q2 2026 release. Each daily value divides that quarter’s revenue by its own calendar days.
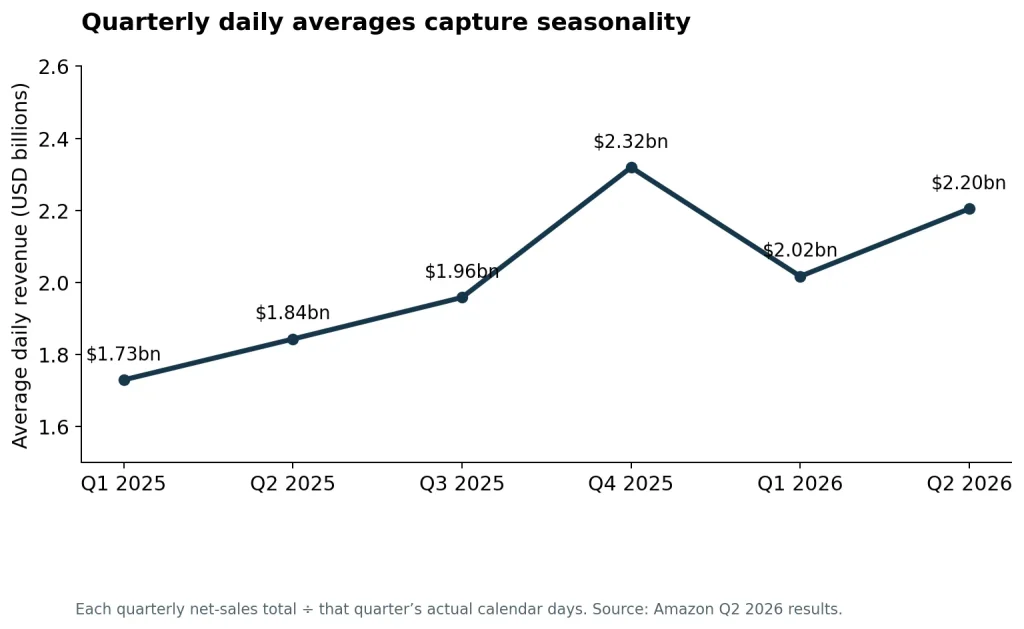
Quarterly comparisons show variation that a single annual average hides.
Why event sales are difficult to compare
A shopping-event statistic might cover consumer spending on a particular marketplace, independently estimated purchases, units sold, or the activity of participating sellers. Amazon’s consolidated revenue has a different scope.
Before comparing an event figure with the annual daily average, check the following:
- Does the figure cover Amazon globally, one country, or one website?
- Does it measure marketplace purchase value or recognized corporate revenue?
- How many days did the event last?
- Is it reported by Amazon or estimated by another organization?
- Does it include services such as AWS, or only shopping activity?
Those questions matter even if both numbers are labeled “sales.” A shared label does not guarantee a shared definition.
Which day is Amazon’s most profitable?
The sources reviewed for this guide do not establish a comprehensive daily net-profit ranking. Calling Prime Day, Black Friday, or Cyber Monday the most profitable day would require profit data, not simply evidence of high customer spending.
Promotions can increase volume while reducing the amount earned per item. Returns and fulfillment expenses can also occur after the purchase date. Treat a claim about the most profitable day as unverified unless its methodology explains those issues.
Do these numbers cover Amazon in the US and Canada?
The headline daily figures cover Amazon’s worldwide consolidated business and are reported in US dollars. They do not describe Amazon.com alone, Amazon.ca alone, or revenue earned solely from US customers. Amazon’s North America operating segment is broader than a country-level revenue disclosure and should retain its reported label.
A reader in Canada may see a dollar sign and assume Canadian dollars. This article uses USD throughout so the underlying financial statements and derived amounts stay consistent.
Can the North America segment stand in for US revenue?
It should not be relabeled that way. A regional segment and a country are different reporting units.
There is another complication: Amazon reports AWS as its own operating segment. Adding a regional label to an AWS-inclusive consolidated figure can therefore imply a geographical scope that the calculation never established.
Use the exact label from the source. If the source says North America, write North America. If it says worldwide, write worldwide. This simple discipline prevents a common type of financial-statistic error.
How would you convert the number to Canadian dollars?
Multiply the USD figure by a clearly dated USD-to-CAD exchange rate. For an illustrative rate of 1.35 Canadian dollars per US dollar, $1 billion USD would equal $1.35 billion CAD.
That rate is hypothetical, not a current currency quote. A published conversion should identify the rate’s source and date. If you are comparing annual financial performance, the appropriate rate methodology may differ from a spot conversion made today.
Keep the original USD figure alongside the conversion. Otherwise, a future exchange-rate movement can make it difficult for readers to reconstruct the calculation.
Why a currency conversion does not reveal Canadian sales
Changing the currency changes the unit of measurement. It does not change where the underlying business activity occurred.
Converting worldwide revenue to CAD still leaves you with worldwide revenue. The result is useful for local purchasing-power intuition, but it is not an estimate of Amazon Canada’s revenue or profit.
The same rule applies in reverse. A US-dollar presentation can contain revenue earned across many countries and converted into the reporting currency.
How does Amazon compare with Walmart and Apple?
Amazon’s daily revenue can be compared with other large companies only when the measurement periods and definitions are visible. Revenue size does not establish profitability, business quality, or stock-market value. Walmart and Apple also use financial-year calendars that differ from Amazon’s December year-end, which limits direct period comparisons.
For a broad scale comparison, Amazon’s 2025 revenue was about $716.9 billion. Walmart reported approximately $713.2 billion for its financial year ended January 31, 2026, while Apple described approximately $416 billion of revenue for its financial year ended September 27, 2025. Walmart’s release and Apple’s announcement identify those periods.
Those amounts put Amazon and Walmart at a broadly similar annual revenue scale for these particular periods. Apple’s revenue was smaller, but that says nothing by itself about how much profit Apple earned from each revenue dollar.
Why the dates need to remain beside the comparison
A table titled “2025 revenue” can hide differences in financial calendars. One company’s 2025 financial year may end several months before another company’s period with a similar name.
For a historical comparison, explicitly label the financial-year end. For a tightly controlled operating comparison, choose matching windows if the available disclosures allow it.
These distinctions become more consequential when a business is growing rapidly or when a major event falls near a period boundary. Similar-looking year labels can contain different economic conditions.
Why marketplace business models complicate revenue rankings
A company that owns inventory and resells it can recognize the customer purchase differently from a marketplace that earns a service fee. Revenue therefore reflects accounting scope as well as customer spending.
Imagine one business reselling $100 of goods and another earning a $15 marketplace fee on $100 of goods sold by an independent seller. Both connect customers with $100 of merchandise, but their revenue lines can differ substantially.
That example does not make one model superior. It explains why the sales number alone cannot measure the full amount of commerce a company influences.
What makes a fairer comparison?
Choose the question first. To compare scale, look at revenue with appropriate definitions. To compare operating profitability, examine operating income and margins. To compare cash generation, use a consistent cash-flow measure. To compare valuation, study price relative to the business results and risks.
A daily revenue figure is a helpful entry point. It becomes misleading when used as the answer to all four questions at once.
How much does Jeff Bezos make from Amazon each day?
Amazon’s corporate revenue is not Jeff Bezos’s daily income. A shareholder owns an interest in the company; the company’s sales and profits remain corporate financial results. Changes in the market value of a shareholder’s holdings are another measurement again, so dividing Amazon’s annual revenue by days cannot calculate Bezos’s personal earnings.
This distinction applies to any public-company founder. Ownership links a person’s wealth to the business, but it does not convert every dollar of business revenue into personal cash.
Corporate income and personal wealth
Suppose a fictional founder owns 5% of a company. If the company generates $100 million of revenue, that does not mean the founder receives $5 million.
The company must pay its expenses and meet its obligations. Even its eventual profit does not automatically become a proportional cash payment to shareholders. Retained funds can remain within the business.
A shareholder might receive cash through a dividend or by selling shares, subject to the circumstances. Those events need their own evidence and timing. Neither can be inferred from annual corporate sales alone.
Why net worth can change without a paycheck
If the share price changes, the estimated market value of a person’s holdings can change. That is a valuation movement, not a salary deposit.
A daily wealth-change estimate also depends on the number of shares owned, the selected dates, and the treatment of other assets and liabilities. Without those inputs, a dramatic “per-second earnings” claim can blend several unrelated concepts.
The clean distinction is between corporate revenue, corporate profit, realized personal cash, and estimated personal wealth. Keeping those categories separate is more useful than attaching one impressive number to all of them.
How much do individual Amazon sellers make per day?
An individual seller’s daily income depends on its own sales, costs, returns, and overhead. Amazon’s consolidated daily revenue cannot predict those results. A seller can have substantial sales and little profit, while another seller with fewer orders can earn more because its products and operating costs differ.
There is no defensible way to divide Amazon’s corporate revenue by a seller count and call the result an average seller’s income. The corporate total includes activities outside the marketplace, and recognized seller-service revenue differs from sellers’ own product sales.
A worked seller example
Consider a hypothetical seller receiving 30 orders per day at $25 each. Daily sales are $750. The following simplified costs show why sales should not be advertised as take-home income.
| Illustrative daily item | Amount |
|---|---|
| Customer sales | $750 |
| Product costs | −$300 |
| Marketplace and fulfillment costs | −$180 |
| Advertising | −$90 |
| Expected returns and other variable costs | −$45 |
| Contribution before fixed overhead and taxes | $135 |
Every amount in this example is invented for teaching, not a quoted Amazon fee or a claim about typical seller performance.
The $135 contribution still needs to cover fixed overhead and applicable taxes. It may also need to compensate the owner for work that has not been included as an expense.
What a beginner should track
A useful seller profit worksheet records product selling price, landed product cost, marketplace charges, fulfillment, storage, advertising, returns, and allocated overhead. It also records when inventory must be paid for and when sale proceeds become available.
That last timing issue can matter even to a profitable business. A seller can need more inventory cash before the earlier batch’s sales proceeds have fully returned.
For readers comparing marketplace selling with other ways to earn, Lexislyfe’s guide to earning $100 a day online provides a separate starting point. Any income target still needs to distinguish sales from the amount left after costs.
How should you read an impressive seller screenshot?
Ask what the screenshot shows. Ordered sales, shipped sales, paid proceeds, contribution, and net profit are different measures.
Then check the period, currency, returns, and omitted costs. A screenshot showing one strong day does not establish a sustainable annual income. It may be accurate as a sales record while remaining incomplete as a profit claim.
What mistakes make Amazon earnings figures misleading?
The most common mistakes combine different metrics, dates, or scopes. Examples include calling revenue profit, labeling a regional segment as US-only revenue, treating marketplace GMV as Amazon sales, and quoting an investment-driven earnings increase as recurring retail profit. These mistakes can survive perfectly correct arithmetic because the inputs describe different things.
Mixing years within one comparison
A revenue figure from 2026 and a net-income figure from 2025 may each be valid. Dividing one by the other, however, does not produce a margin for either period.
To calculate a margin, use revenue and profit from the same window. If you intentionally compare different periods, state that comparison and explain why.
Reporting a forecast as a completed result
Guidance describes expectations. A reported result describes a period that has already occurred and been disclosed.
An article can reasonably discuss both, but it should use language such as “expected,” “forecast,” or “illustrative” for the forward-looking number. Putting a future year in a headline does not turn a forecast into an actual result.
Adding overlapping categories
AWS can appear in both Amazon’s segment presentation and its revenue-category presentation. North America and International also contain multiple kinds of revenue.
Choose one complete classification for an additive breakdown. Do not add a second classification on top simply because its labels look different.
Inferring orders from revenue
Dividing consolidated revenue by an assumed basket size does not produce a reliable order count. The numerator includes cloud services, advertising, subscriptions, and other activity that cannot be converted into retail baskets that way.
Even a retail-only numerator would still need a compatible definition of order value, returns, currency, and period. Packages add another complication: an order and a shipment are not necessarily the same unit.
Treating revenue as a live cash counter
A per-second average is a mathematical allocation. It is not connected to Amazon’s transaction systems and does not describe the exact timing of revenue recognition or cash collection.
A website animation can make that average look live. Its visual movement does not change the quality or frequency of the underlying data.
Assuming more formatting means better evidence
A table, chart, or bold figure can make a statistic easier to read. None can repair a wrong year or an unsupported definition.
A trustworthy answer lets you trace the headline number back to a named financial line, a reporting period, and a reproducible calculation. That is the standard to use when two polished articles disagree.
Why can two accurate articles give different daily figures?
Two articles can calculate different daily amounts correctly if they use different reporting windows, metrics, or rounding conventions. Compare the inputs before deciding which answer is wrong. A completed-year average, a trailing-twelve-month average, and a quarterly average describe related but distinct sets of historical results, even when all three are current.
Different windows can describe the same growing business
Consider a hypothetical company with $365 million of sales in a completed year. Dividing by 365 gives $1 million per day. In the next quarter, suppose it reports $108 million over 90 days, producing a quarterly average of $1.2 million per day.
Those answers do not contradict each other. The first describes the whole completed year; the second describes the newer quarter. Neither proves that every day in the quarter generated $1.2 million.
If an article replaces the annual answer with the quarterly one, its method should say so. Otherwise the reader may interpret a change in the reporting window as an apples-to-apples increase in the same statistic.
Different metrics can move in opposite directions
Imagine the same company increases revenue but buys equipment and incurs more operating costs. Its daily sales average can rise while its daily free-cash-flow average falls.
That is a possible combination, not an accounting contradiction. It tells you to examine the spending and cost structure. Calling one number wrong because it moved differently from another would discard useful information.
Similarly, an investment valuation gain can lift net income without a matching increase in operating income. The measurements capture different events, so their divergence needs an explanation rather than an attempt to force them to match.
Rounding can create small apparent inconsistencies
Suppose one writer starts with a rounded $717 billion annual total, while another uses the reported $716.924 billion. Both might publish $1.96 billion per day after rounding, but their hourly figures can differ slightly.
For a consistent article, retain the reported total in the calculation and round only the displayed result. Do not recalculate the hourly value from a daily figure that has already been rounded to two decimal places.
This is especially useful when several tables appear together. A reader should be able to move between annual, daily, and hourly figures without finding unexplained changes in the underlying precision.
How to reconcile the disagreement
Write down each source’s metric, period, scope, day count, and rounding method. Matching entries should produce matching calculations within rounding tolerance. Different entries identify the reason for the disagreement.
If all five inputs match but the answers still differ substantially, check unit conversion and arithmetic. If the inputs cannot be found, describe the claim as insufficiently documented instead of guessing which method the author intended.
How can you check any daily-revenue claim in one minute?
Use four checks: identify the metric, identify the reporting period, confirm the business scope, and reproduce the arithmetic. This is a practical checking framework developed for this guide. It helps explain disagreements without assuming that every different-looking number is wrong or that every recent headline uses recent data.
Check 1: What exactly is measured?
Look for a precise term such as net sales, operating income, net income, or operating cash flow. The word “earnings” can be used loosely, so read the definition behind it.
If the claim concerns marketplace purchase value, identify that separately. Do not accept a revenue label without confirming whose revenue is being measured.
Check 2: Which dates does it cover?
Find the period end and the length of the window. An article’s publication date is not necessarily the date of its financial data.
A statement published in October can still rely on an earlier annual report. That may be a sensible choice, but the financial period should remain visible.
Check 3: Which business is included?
Confirm whether the number covers worldwide Amazon, a geographical segment, one storefront, outside sellers, or a specific activity such as AWS.
A global consolidated figure cannot be narrowed to a country simply by changing the surrounding sentence. The scope needs support in the source data.
Check 4: Does the division work?
Divide the total by the actual days. Check the table’s units before entering the number, and keep intermediate values unrounded.
For a quick reasonableness test, multiply the published daily average by the day count. The result should be close to the stated annual or quarterly total, allowing for rounding.
A claim that fails despite correct division
Suppose an article divides $638 billion by 365 and calls the answer Amazon’s latest completed-year revenue per day. The division itself is straightforward. The claim can still fail if $638 billion belongs to an older year or the actual year contains 366 days.
This is why arithmetic verification and source verification belong together. A calculator checks the operation; the financial statement checks what you should be calculating.
How do costs and margins change the daily answer?
Costs determine how much of Amazon’s revenue becomes operating profit, while non-operating items and taxes determine the next steps toward net income. A daily revenue figure contains no direct information about those relationships. To understand profit, calculate a margin from matching-period revenue and profit, then examine what changed.
The basic operating-margin formula is operating income ÷ revenue × 100. Net margin uses net income in the numerator instead. Using different numerators produces different measures, even when both are described casually as a profit margin.
A simple margin exercise
Imagine a business with $10 million of daily sales. At a 2% operating margin, it earns $200,000 of operating profit. At a 10% margin, it earns $1 million.
Both businesses have the same sales scale. Their operating results differ by a factor of five. That is why comparing Amazon’s daily sales with another company’s daily profit is not a meaningful comparison.
The example is hypothetical. It illustrates a mathematical relationship, rather than a forecast of Amazon’s margins.
Fixed and variable costs
Some costs change closely with activity. More items shipped can mean more packaging and transportation expense. Other costs support capacity and do not change in the same proportion over a short period.
A business that already has spare capacity may spread some fixed costs across more sales as volume grows. A business that needs to build new capacity may spend heavily before the new capacity produces its expected revenue.
Those possibilities explain why sales growth can have different profit effects at different times. The headline growth percentage does not identify the cost response automatically.
Why a percentage-point change matters
A move from a 5% margin to a 6% margin is a one-percentage-point improvement. Relative to the original margin, it is also a 20% increase in the margin percentage.
Those descriptions answer different questions. Mixing them can exaggerate an apparent improvement. When comparing financial reports, check whether a source means percentage points, percent growth, or basis points.
A basis point is one hundredth of a percentage point. That terminology is useful when companies discuss relatively small changes in margins across very large sales totals.
What can investment spending tell you about future daily earnings?
Investment spending shows resources committed today, while future daily earnings depend on the revenue and costs those resources eventually produce. Neither high spending nor high current profit settles whether an investment will succeed. A useful assessment separates current cash requirements, accounting expense, expected operating benefits, and the uncertainty surrounding those benefits.
This is a conceptual framework, not an Amazon earnings forecast. The reported daily numbers describe past periods; future results need assumptions.
Spending today and expense over time
Suppose a fictional business buys equipment for $1 million. The cash payment may occur immediately, while the accounting expense is spread over the asset’s useful life under the relevant policies.
That creates a timing difference. Cash flow can fall sharply in the purchase period even if the income statement records only part of the cost then.
When the equipment begins operating, it can generate revenue and additional expenses. Whether the investment was worthwhile depends on the resulting cash flows and risks, not only on the first period’s accounting profit.
Capacity before demand
Building capacity before it is fully used can create a temporary drag on returns. Waiting too long can create a different problem: a business may be unable to serve customers when demand arrives.
Analysts therefore need more than one period’s capital-spending total. They need to understand utilization, timing, commitments, expected demand, and the cost of maintaining the capacity.
A daily-revenue conversion cannot resolve those questions. It can supply context about scale while the investment analysis uses a broader set of inputs.
Why operating income also needs context
Operating income excludes some items that can make net income volatile, but it still reflects operating-accounting choices and expenses. It should not be described as a perfectly normalized measure of cash generation.
The better habit is to use several measurements consistently. Revenue shows recognized sales. Operating income shows the operating result. Net income shows the final accounting result. Cash flow shows a different view of resource movement.
Each measurement adds information; none eliminates the need to understand the others.
How should students, journalists, and business owners use these figures?
Use Amazon’s daily averages to explain scale, then choose additional evidence for the specific question you are answering. Students need a clear formula and source; journalists need precise dates and definitions; business owners need their own unit economics. A dramatic corporate statistic should not substitute for any of those requirements.
For a school or university assignment
Record the company name, financial period, reported total, source, day count, and derived average. Explain that the daily result is your calculation.
A short methodology note is stronger than an unexplained long decimal. It shows that you understand the difference between the original disclosure and the measurement you created from it.
If you compare profit with revenue, use matching periods. If you compare companies, include each financial-year end and explain any mismatch.
For an article, video, or social post
Keep the metric in the sentence containing the number. “Amazon averaged $1.96 billion in daily revenue in 2025” is much harder to misread than “Amazon makes $1.96 billion a day.”
Avoid implying that a mathematical average is a live observation. If you use an animated counter, label its underlying period and calculation beside it.
When a new report changes the inputs, update the chart, caption, table, and headline answer together. Otherwise the same page can present incompatible versions of the statistic.
For a seller planning a business
Begin with your own contribution per order, fixed overhead, working-capital needs, and realistic sales scenarios. Amazon’s scale tells you that the platform is large; it does not tell you the demand for your particular product.
A useful decision sequence is to estimate costs, test demand, review actual results, and revise the assumptions. Corporate revenue provides context, while the seller’s own records provide the evidence for its income expectations.
For an investor studying the company
Daily revenue is a presentation format, not a valuation model. A stock’s attractiveness depends on the price paid relative to future cash generation, investment requirements, and risks.
Two investors can agree on the historical daily-revenue calculation and still reach different valuation judgments because their future assumptions differ. The conversion does not settle those assumptions.
This article explains financial measurements. It does not estimate a target share price or recommend a transaction.
How can you update the calculation after the next report?
Replace the financial inputs with the next reported period, retain the exact reporting dates, and recalculate every dependent figure from unrounded totals. Update the revenue, profit, cash-flow, and segment explanations together. A changed date in the headline is insufficient if the tables and conclusions still describe an earlier period.
An update worksheet
A reliable worksheet stores the source total separately from the calculated output. That makes errors easier to trace and lets you update the article without manually editing every derived amount.
Use fields for the metric name, start date, end date, calendar days, reported units, original total, converted dollar total, and daily average. Add a short note for unusual items that affect interpretation.
The following sequence keeps the update controlled:
- Save the new source’s title and publication date.
- Enter the totals exactly as reported, including their stated units.
- Confirm whether the window is a quarter, year-to-date period, full year, or trailing twelve months.
- Recalculate daily, hourly, minute, and second values from the unrounded inputs.
- Check that category and segment totals reconcile where they should.
- Review any non-operating gains, charges, or cash-flow changes.
- Revise every affected table, chart, answer, and source note before changing the update date.
How to rebuild a trailing-twelve-month total
If a company does not supply the trailing total directly, one approach is to add the latest completed annual total, add the current year-to-date total, and subtract the comparable prior year-to-date total.
For example, a hypothetical company with annual sales of $100, current first-half sales of $60, and prior first-half sales of $45 has trailing sales of $115. The formula is $100 + $60 − $45.
The periods need to align, and any restatements or accounting changes need attention. Do not add a year-to-date figure to the whole prior year without subtracting the overlapping prior period.
What should remain in the historical section?
Completed-year figures can remain unchanged unless the company restates them. New results extend the series; they do not automatically replace historical observations.
The current headline answer, however, should identify the newly chosen reporting window. If you keep the latest completed year as the main answer, say so clearly even after a newer quarter arrives.
That editorial choice is reasonable when it is explicit. The reader should never have to infer whether the page means the latest quarter, latest full year, or latest twelve months.
Frequently Asked Questions
Amazon’s daily revenue and profit depend on the financial metric and reporting window you choose. The answers below use the completed 2025 year for a consistent baseline, with the newer twelve-month revenue figure identified separately. They also distinguish company results from seller earnings, founder wealth, and individual shopping-event sales.
Conclusion
Amazon averaged about $1.96 billion in daily revenue and $212.8 million in daily net income in 2025. Its newer twelve-month revenue average through June 2026 was about $2.13 billion per day. These figures describe different periods and metrics, so their labels should travel with them whenever they are quoted.
The most useful habit is to keep four details attached to any daily figure: what it measures, when it was measured, which business it covers, and how it was calculated. With those details visible, a large number becomes something you can check, compare, and explain.